Case study›Solar · New Jersey · ReadyMode
The data stopped being the bottleneck
Across 22 days and 107,574 dials on Scout Data, a New Jersey solar call center rated answer rate and calls-to-connect strong on every single day against its own scorecard.
- Who
- A New Jersey solar call center
- Sells
- Solar power-purchase agreements, by phone
- Market
- New Jersey today, Pennsylvania next
- Team
- ~30 contract dialers, live transfer to closers
- Dialer
- ReadyMode predictive, ~3.6 lines per agent
- Volume
- ~6,421 dials per weekday
Their scorecard, not ours
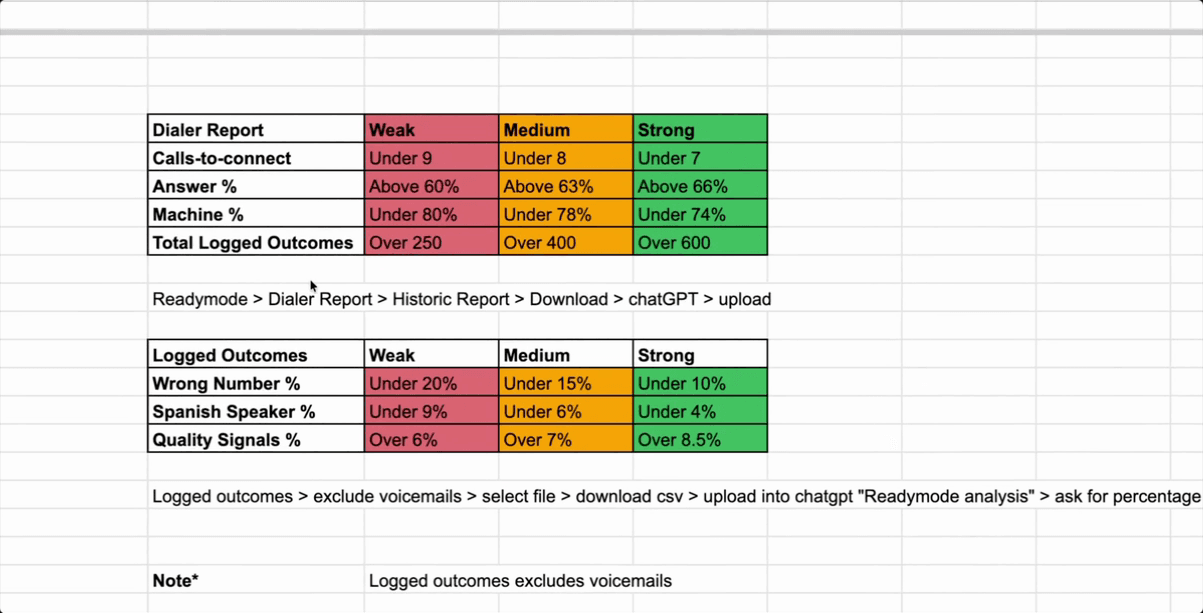
This floor grades every list on numbers pulled straight from the dialer’s historic report, against weak, medium and strong bands it set itself. Here is where Scout Data landed for August 1–22, measured against those bands. 107,574 calls.
Scout Data vs. the floor’s own bands
Day by day
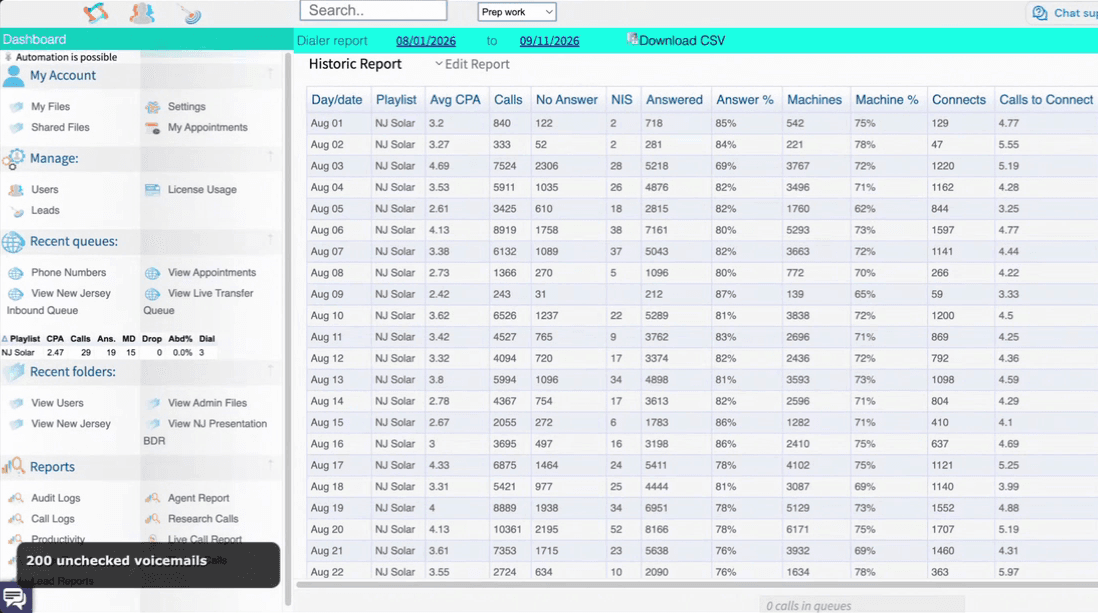
The totals could hide a bad week, so here is each day on its own. Answer rate and calls-to-connect rated strong on all 22 days. Machine rate ran 62.5–78.7%: strong on 16 days, medium on 4, weak on 2, and both weak days fell on weekends with light volume.
Answer rate
Machine rate
Calls to connect
Show the daily numbers as a table
| Day | Dials | Answer rate | Machine rate | Calls to connect |
|---|---|---|---|---|
| Sat Aug 1 | 840 | 85.5% | 75.5% | 4.77 |
| Sun Aug 2 | 333 | 84.4% | 78.7% | 5.55 |
| Mon Aug 3 | 7,524 | 69.3% | 72.2% | 5.19 |
| Tue Aug 4 | 5,911 | 82.5% | 71.7% | 4.28 |
| Wed Aug 5 | 3,425 | 82.2% | 62.5% | 3.25 |
| Thu Aug 6 | 8,919 | 80.3% | 73.9% | 4.77 |
| Fri Aug 7 | 6,132 | 82.2% | 72.6% | 4.44 |
| Sat Aug 8 | 1,366 | 80.2% | 70.4% | 4.22 |
| Sun Aug 9 | 243 | 87.2% | 65.6% | 3.33 |
| Mon Aug 10 | 6,526 | 81.0% | 72.6% | 4.50 |
| Tue Aug 11 | 4,527 | 83.1% | 71.7% | 4.25 |
| Wed Aug 12 | 4,094 | 82.4% | 72.2% | 4.36 |
| Thu Aug 13 | 5,994 | 81.7% | 73.4% | 4.59 |
| Fri Aug 14 | 4,367 | 82.7% | 71.8% | 4.29 |
| Sat Aug 15 | 2,055 | 86.8% | 71.9% | 4.10 |
| Sun Aug 16 | 3,695 | 86.5% | 75.4% | 4.69 |
| Mon Aug 17 | 6,875 | 78.7% | 75.8% | 5.25 |
| Tue Aug 18 | 5,421 | 82.0% | 69.5% | 3.99 |
| Wed Aug 19 | 8,889 | 78.2% | 73.8% | 4.88 |
| Thu Aug 20 | 10,361 | 78.8% | 75.6% | 5.19 |
| Fri Aug 21 | 7,353 | 76.7% | 69.7% | 4.31 |
| Sat Aug 22 | 2,724 | 76.7% | 78.2% | 5.97 |
What’s working
Most of the walkthrough was not about data at all. It was about the machine around the data. These are the parts the floor pointed to.
A transfer, not a booked meeting
Cold-set video calls had poor show rates: it takes real skill to get a stranger to show up with their spouse. Now the dialer rep’s only job is to find genuine interest and hand the call off live.
- The setter runs a hook, a story, and an offer, explaining the power-purchase agreement in plain terms.
- The setter asks whether the homeowner would mind a senior advisor joining for a quick check on whether the home qualifies.
- The live transfer rings the closers in order, about eight seconds each.
- The closer spends 15 to 20 minutes on the call and books a presentation with both decision-makers.
- Text workflows follow up with anyone who does not show.
Every contact gets worked, on a schedule
Lists go out in 3,000-contact batches. Each contact gets three attempts up front, then settles into a widening cadence that never quite stops.
Caller ID is managed like inventory
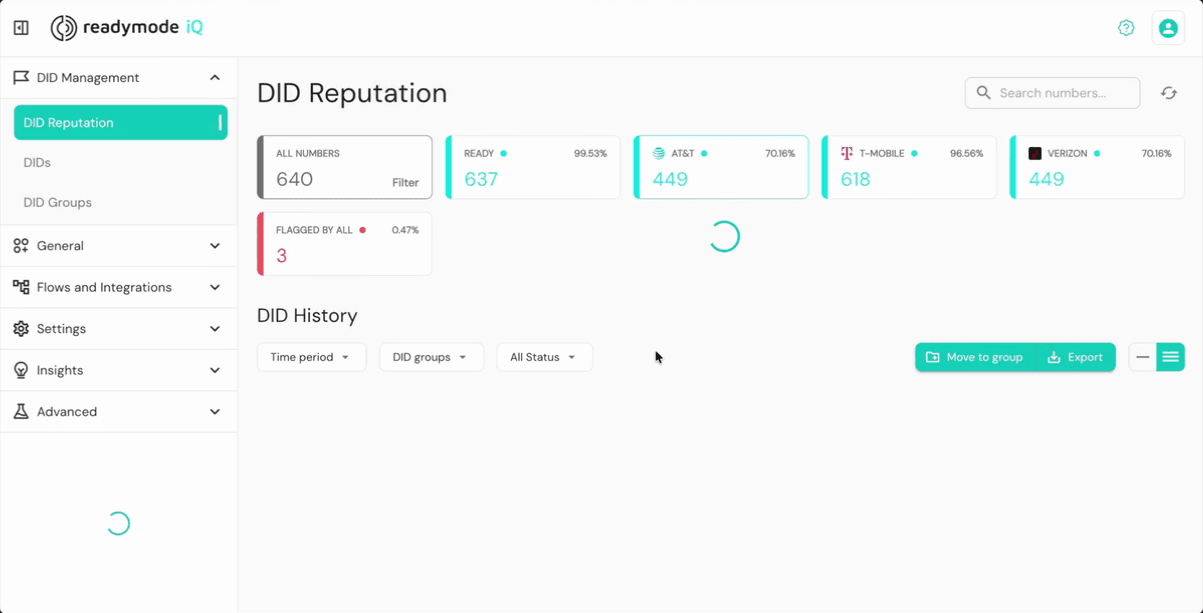
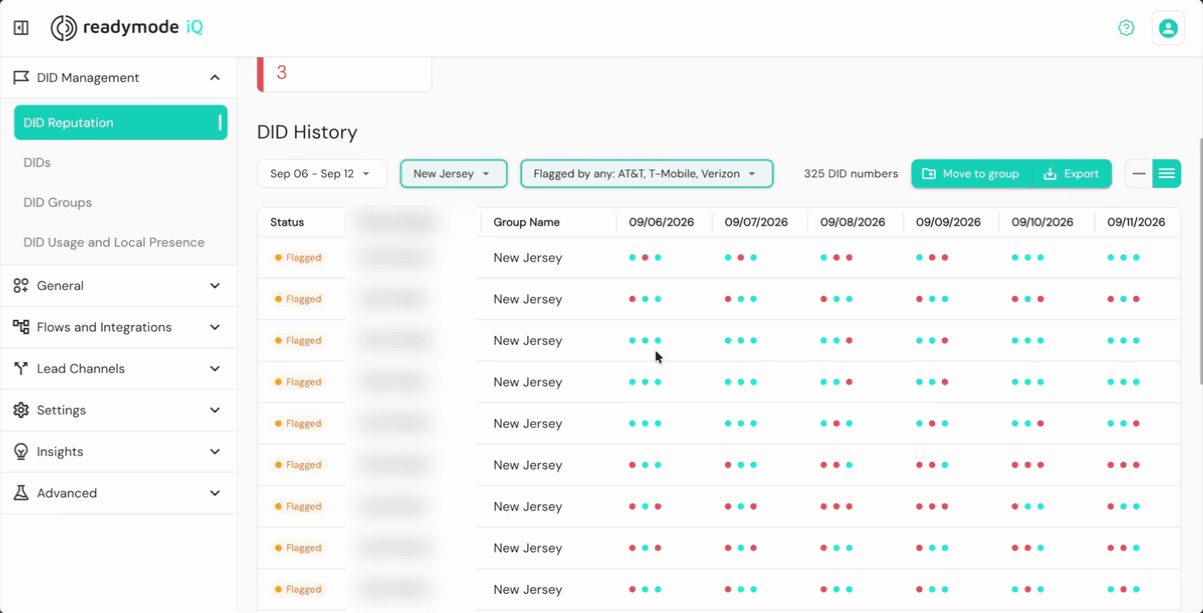
High-volume outbound numbers get flagged as spam, and a flagged number looks exactly like a bad list. The dialer re-registers the floor’s numbers every day, checks each prospect’s carrier before dialing, and calls from a local number that carrier has not flagged. In the week of September 6–12, 325 of their numbers were flagged by at least one carrier, and the dialer routed around every one of them.
Measured every week, in a spreadsheet
No BI stack. The owner exports the historic report, runs it through a saved analysis prompt, and grades the result against the sheet above. Logged outcomes, with voicemails excluded, go through the same loop and are expressed per 1,000 calls.
Short sessions, the right hours
Thursday is their best day by a long shot. The best windows are mid-morning and late evening. And no one should cold call for eight hours: past about three, results fall off a cliff.
Where the bottleneck moved
Once the list clears the scorecard every day, the leverage is inside the call: the script, and the show rate on presentation calls. The floor’s next project is transcribing every conversation to surface the talk tracks that actually move a homeowner to a presentation. That is the point of this story. The data stopped being the thing they worried about.