Proof
Measured in their dialer, not in our deck.
Every study here is built from the customer’s own dialer export, joined back to the file we delivered, and published with the method. Names appear when the customer approves them.
Case studies
Two call centers, where they started and where they went.
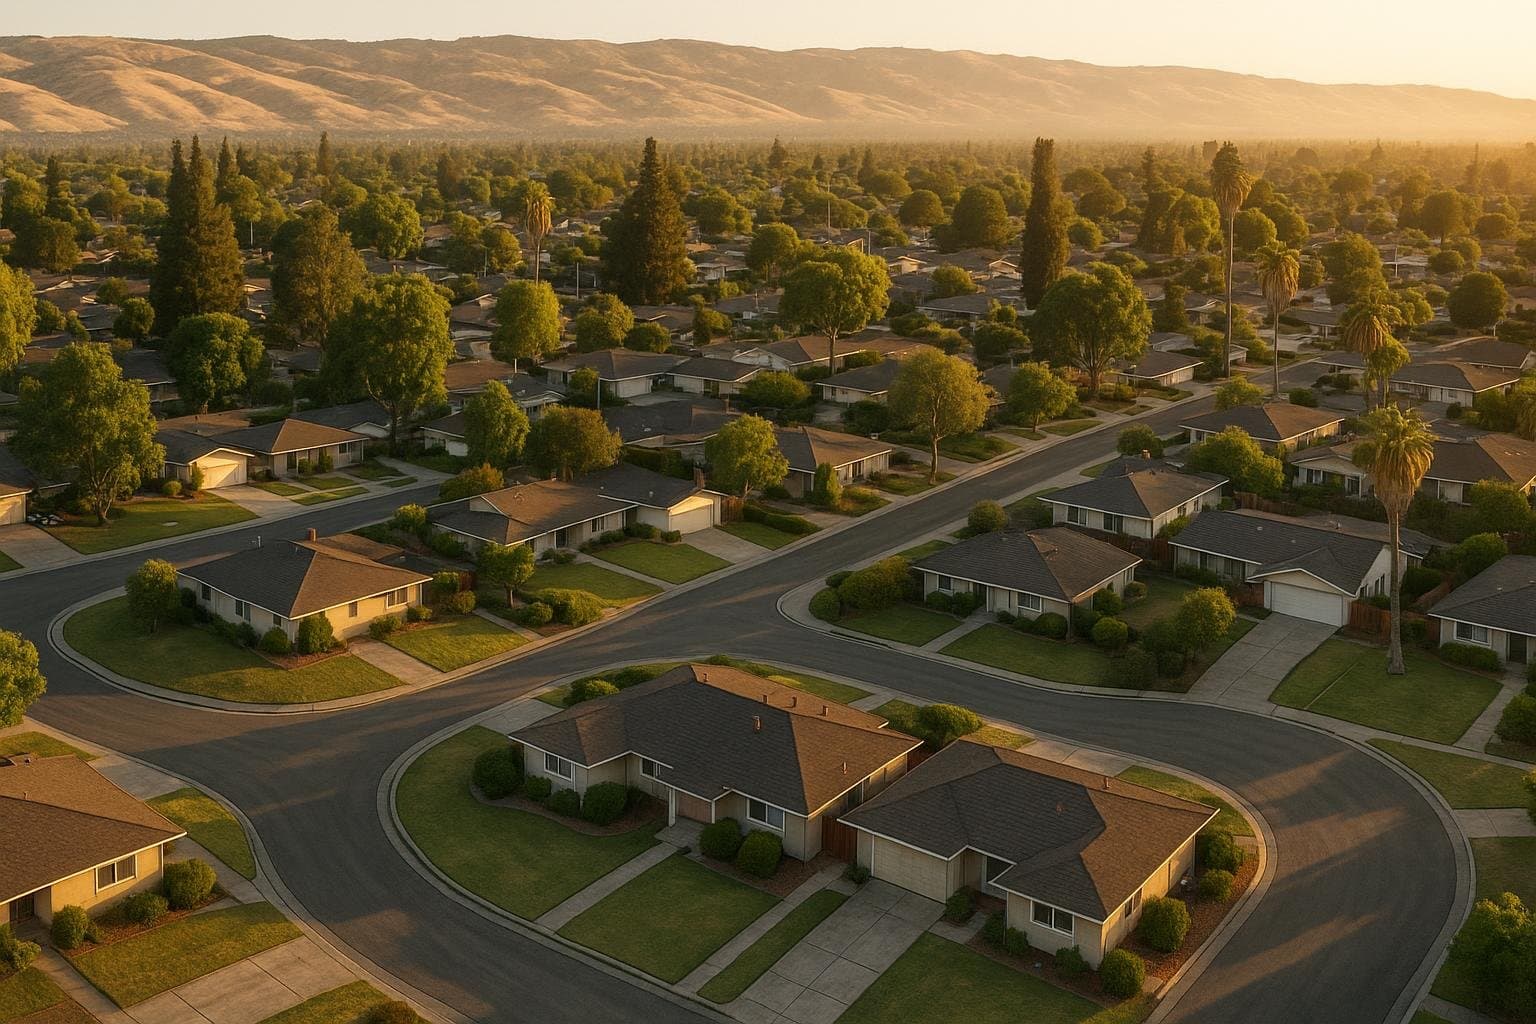 Solar · Bay Area · CallTools9deals closed in four weeks, from the month’s appointmentsA California solar call centerEleven agents, three 25,000-record files, 122 appointments in three weeks, and nine deals closed four weeks after the first file. The call log changed how the next file was picked: the third was ranked on what had already booked, before anyone dialed it, and out-booked the first by 36% on the same number of passes.Read the case study
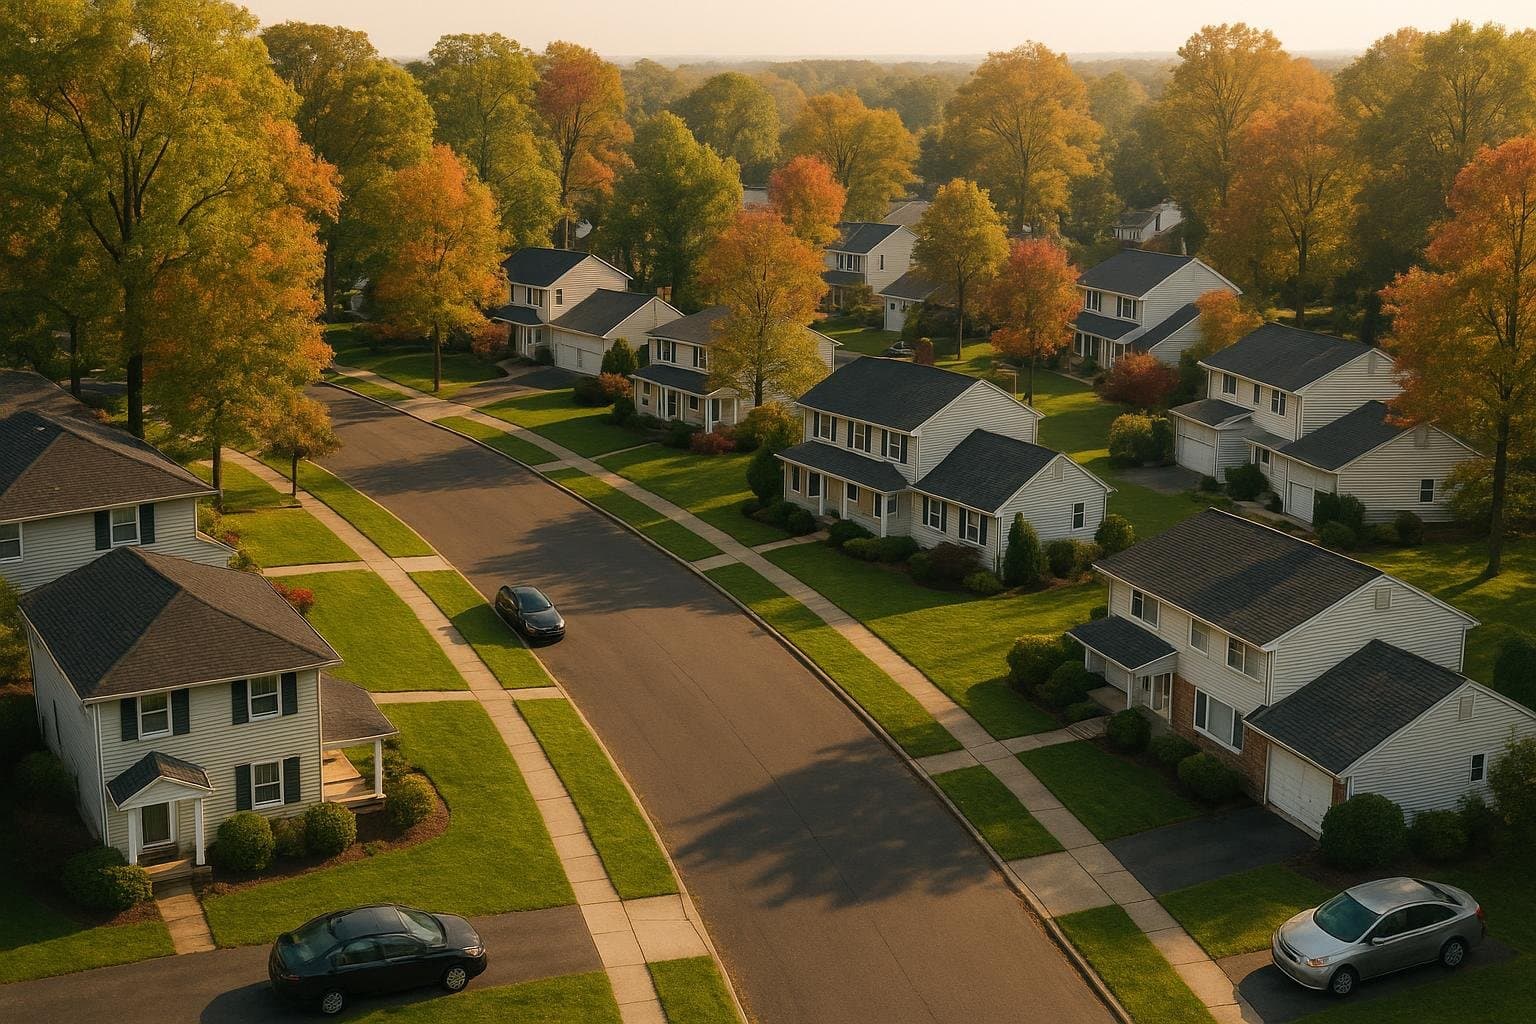 Solar · New Jersey · ReadyMode$200Kin one month, 18 deals, every one from a cold callA New Jersey solar call centerEighteen months of cold calling into a Florida market that had stopped paying, then the floor moved its dialing to New Jersey. August: 18 power-purchase agreements, about $200,000 in commission, every one from a cold call — on a file whose answer rate and calls to connect graded strong on all 22 days in their own dialer.Read the case study
Wall of Love
In their own words, on camera.
Benchmarks
The measured numbers, with their samples.
Nothing is rounded up, and every figure carries the sample it was counted on and the month. This is what makes the stories above read as measured rather than curated.
- 4.55%agent connect per dial, first pass74,913 first dials · Aug 31 – Sep 18, 2026
- 122appointments in three weeks, from 75,000 records348,858 dials on 74,913 records · Aug 31 – Sep 21, 2026
- 4.58calls per live pickup107,574 calls · Aug 1–22, 2026
- 54.6%of homes yield the owner with a live mobile18,309 single-family parcels, Texas · Aug 18, 2026
Read from customers’ own dialer exports and reports.Every benchmark, with its method
Research
Original statistics on American homes.
Derived from our own permit and property databases. The source, not a vendor quoting someone else’s numbers.
- Solar permit statistics: U.S. residential installs by stateScout Data's permit database shows 4,586,606 residential solar permits across 1,154 counties, of which 347,293 were issued in the past 12 months.
- What percentage of homes have solar? Rooftop counts by state5.55% of U.S. single-family homes carry solar panels on the roof, seen from aerial imagery.
- How often does a home solar install include a battery?Of 368,049 residential solar permits filed in 2025, 28.98% state that the job includes energy storage, against 0.13% in 2015.
- Solar permits that never got installed: one roof in five is bare21.0% of single-family homes with a solar permit have no array visible on the roof today.
- Bankrupt solar installers: the full Scout Data list102 residential solar installers are on the Scout Data bankrupt installer list; 29 are Chapter 7 liquidations and 8 are Chapter 11 cases.
- Roof replacement statistics: what roofing permits showAmong homes with two or more observed roofing permits, the median interval between them is 14 years.
- What is the most common roofing material? U.S. roofs by stateOf U.S. single-family homes where the roof material is recorded, 77.4% carry asphalt or composition shingle.
- How often is a home HVAC system replaced?Across homes with two or more permits for the same equipment, the median gap is 13 years for a furnace or boiler and 12 for air conditioning.
- How old are American homes?The median U.S. single-family home was built in 1979, making it 47 years old in 2026, from build years on 79,636,129 single-family homes.
- How long do people stay in their homes? Tenure by stateReading the last recorded sale on every single-family home, the median owner-occupant has been in the same house for 9.8 years.
- How many single-family homes do companies own?Across 85,061,162 single-family homes, 5,353,183 (6.3%) are titled to a business entity rather than to a person.
- Where are people moving? What the parcel data showsAcross 85,061,162 American single-family homes, 4,166,289 were built since 2020, and where they landed is very unevenly distributed.
- Door knocking statistics: what 237,000 real knocks showOn real field days, someone answers at 37.0% of knocked doors; 63.0% reach nobody.
Cite any figure with a link to its page.The research index